In this post, I am going to share my hands-on experience measuring the actual downtime you can expect when scaling an Azure SQL Managed Instance (SQL MI) up or down. Specifically, I will be walking you through a real-world test of scaling storage size and vCores using a free-tier SQL Managed Instance.
I will append the results of downtime when scaling service tiers and hardware series in future. Below are the overall results of Scaling up/down the vCores and Storage size.
Overview results of Scaling up/down vCores:
Scaling database vCores whether up or down is a 6-step process that takes approximately 30 minutes from start to finish. However, the operational impact on applications is minimal: the database experiences only 1 to 2 minutes of actual downtime during the final compute switch.
Outside of this brief window, the database remains fully accessible while the background scaling operations complete.
Application Impact: Your applications will only lose connection to the database for 1 to 2 minutes when the compute switch actually occurs. Retries should be configured in your application logic to handle this brief drop.
| Metric | Scale Up (4 to 8 vCores) | Scale Down (8 to 4 vCores)* |
| Actual Downtime | 1–2 minutes | < 1 minute |
| Total Operation Time | ~26 mins | ~29 mins |
| Total Steps to complete Scale up/down | 6 steps | 6 steps |
| Database Access | Inaccessible during downtime | Inaccessible during downtime |
Overview results of Scaling up Storage Size:
Scaling storage up or down does not cause the database to go offline or become inaccessible. Throughout my testing, I maintained continuous connectivity to the database without any interruptions.
| Metric | Scale Up (32 to 64GB) | Scale Down (64 to 32GB)* |
| Actual Downtime | 0 sec | 0 sec |
| Total Operation Time | ~2 mins | ~2 mins |
| Database Access | Accessible during the scale up operation. | Accessible during scale down operation. |
As part of my testing, I am using single instance to scale up or down the SQL MI. This doesn’t cover scaling when you have failover group setup with two SQL instances.
I will cover the scaling downtime for SQL MI in a failover group in upcoming blogposts.
My SQL Managed Instance Overview Before scaling up:
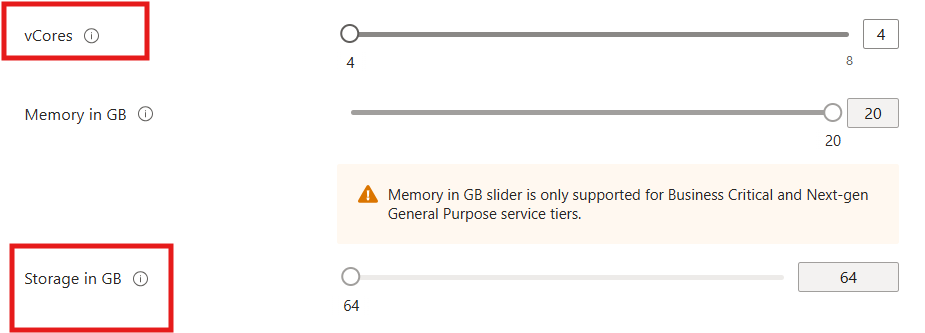
To ensure absolute transparency and to help you replicate this test, here is the exact configuration of the SQL Managed Instance I am using for this demonstration for scaling vCores:
| Configuration | Details |
| Region | South India |
| Current Status | Running |
| Architecture | Single Instance (Free Tier) |
| Networking | Public Endpoint Connection (Enabled) |
| Compute | 4 vCores |
| Storage | 64 GB |
| Service Tier | General Purpose |
A paid instance is used for testing Storage size scaling up/down operations as the free instance doesn’t have the option to scale storage.
Prerequisites for Testing:
If you want to follow along and test the downtime in your own environment, you will need a few things set up beforehand:
- An active Azure account with an operational SQL Managed Instance.
- A test database created inside your managed instance, ideally populated with a few tables. Even, one table is also enough for testing.
- A database management tool to monitor connectivity. I am using SSMS version 21 for this test.
The Testing Methodology:
To accurately capture the downtime, the process is straightforward:
- Initiate the scaling operation: For this demonstration, I will be performing the scale up/down directly through the Azure Portal. However, keep in mind that you can achieve the exact same results using PowerShell or the Azure CLI for automated workflows.
- Monitor the connection: While the scaling operation is running in the background, I will use SSMS to continuously test the connection to the database.
- Execute test queries: I will repeatedly query the table or do insertions into the table in my database during the operation. The exact moment the query fails and subsequently reconnects will give us our precise window of downtime. I also used an insertion script which loops 10000 times with a wait time of 1 sec to insert records into the table.
Scaling up vCores in SQL Managed Instance:
We will perform scale up on vCores of SQL Managed Instance.
vCores from 4 to 8:
Here I will scale up the instance Vcore from 4 to 8 Vcores and it is totally no additional cost in SQL MI free instance.
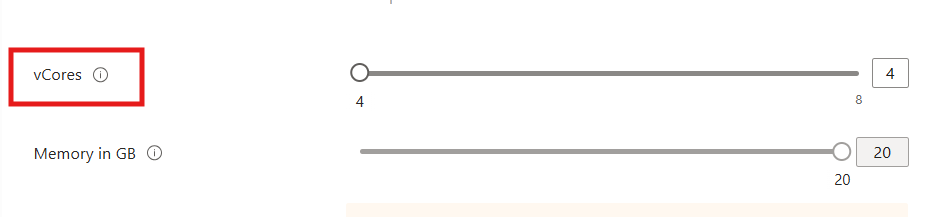
I have 4 existing Vcores before scaling up:
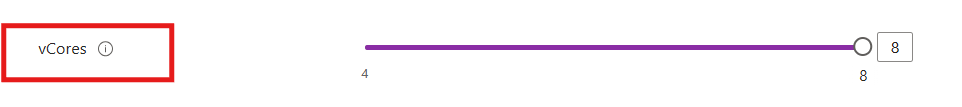
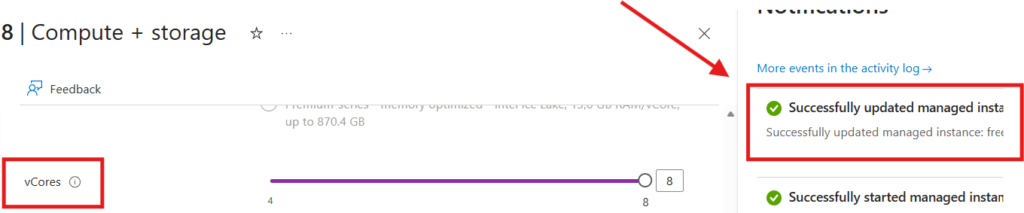
Now I will increase it to 8 vCores.
As soon as you hit the Apply button to confirm scaling up the vCores, jump to SSMS tool and run the queries for few minutes to check for downtime.
You can run the below automation script which inserts records into the table. So, you can see the error in SSMS once the connection to the database is lost.
DECLARE @i INT = 1;

WHILE @i <= 10000
BEGIN
    INSERT INTO TestTable VALUES (@i);

    -- Wait for 1 second
    WAITFOR DELAY '00:00:01';

    SET @i = @i + 1;
ENDCheck Operation status:
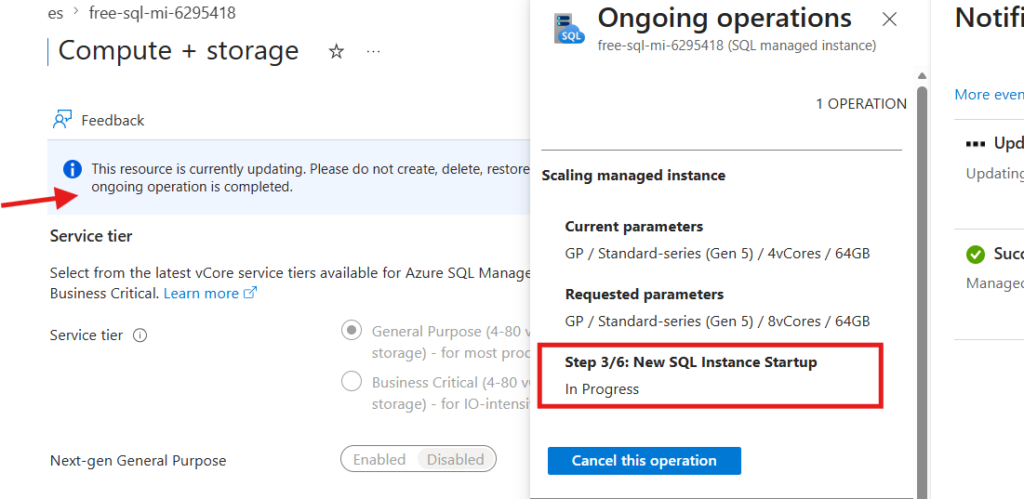
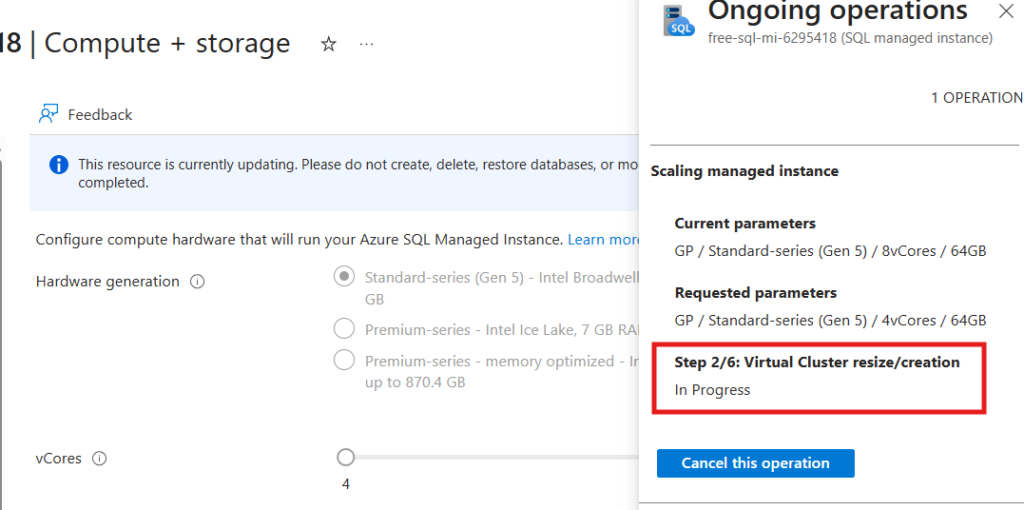
Check Ongoing Operation status of scaling up vCores and how many steps left to complete the scale up. If you click on the information dialogue, it will show you the status.
Till the first 3 steps, you don’t notice any downtime, and you queries will work or insertions to the table will work as expected.
Actual Downtime:
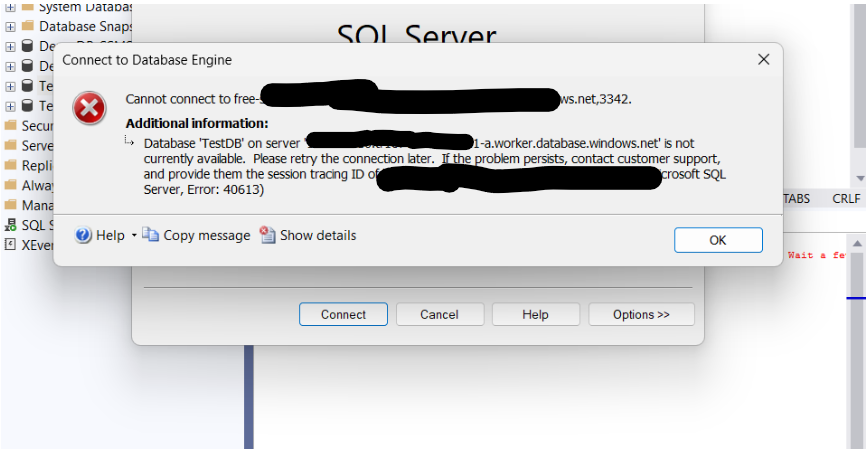
During Step 4/6: Attach Database, you will lose access to the database connectivity (between 1 to 2 minutes). I got below message, while my execution insertion loop query is running, suddenly I lost access to the database connection.
When Step 5 starts, you will regain access to your database again.
Scaling up vCores completed
The scaling up of vCores from 4 to 8 completed in 26 minutes.
Scaling Down vCores in SQL Managed Instance
We will perform scale down on vCores of SQL Managed Instance.
vCores from 8 to 4:
Here, I will scale down the instance Vcore from 8 to 4 and it is totally no additional cost in SQL MI free instance.
I have 8 existing vCores before scaling down:
As soon as you hit the Apply button to confirm scaling down the vCore, jump to SSMS tool and run the queries for few minutes to check for downtime.
You can use the same automation script as given above while scaling up.
Check Scale down Operation status:
Check Ongoing Operation status of scaling down vCores and the steps left to complete the scale down. If you click on the information dialogue, it will show you the status.
Till the first 3 steps, you don’t notice any downtime, and you queries will work or insertions to the table will work as expected.
Actual Downtime:
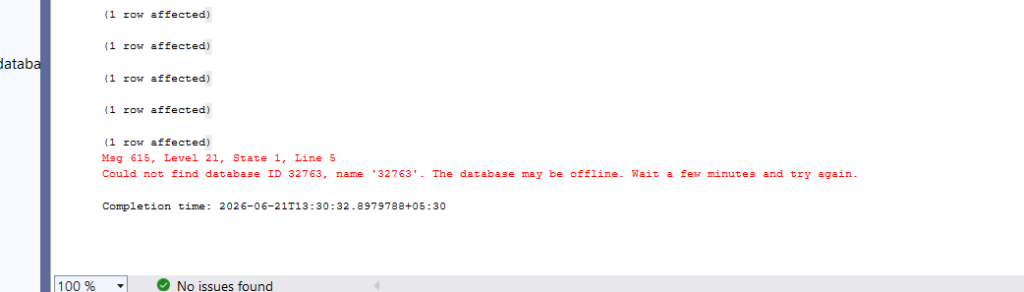
The steps 4 and 5 are immediately executed and when the database connection is lost, I got below error.
Msg 615, Level 21, State 1, Line 5
Could not find database ID 32763, name ‘32763’. The database may be offline. Wait a few minutes and try again.
The actual downtime is recorded as less than a minute.
After a minute, I am able to query my database table as usual.
Scaling down vCores completed
The scaling up of vCores from 8 to 4 completed in 29 minutes.
Scaling Up Storage Size in SQL Managed Instance
Now, when coming to storage size scaling operation, there is no downtime during either of the operation.
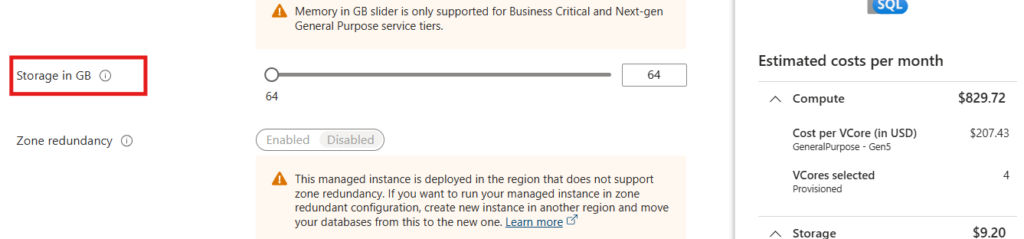
Scaling up Storage size from 32 GB to 64 GB:
I have given 64 GB storage to increase the storage size from 32 GB.
Actual downtime:
Noted as 0 sec. My automation insertion ran successfully and I didn’t lose connectivity to my database.
Overall operation completion time:
2 minutes to complete overall storage size scale up.
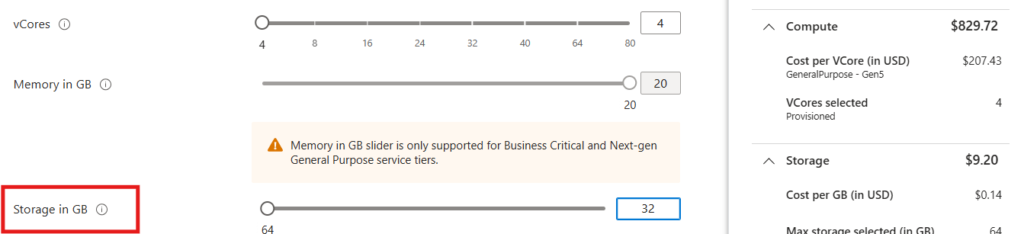
Scaling Down Storage Size in SQL Managed Instance:
Now, performing scaling down from 64GB to 32GB.
Actual downtime:
Downtime is 0 sec. The script is running as expected and records are inserting into the table during the scale down.
Overall operation completion time:
1 minute to complete overall storage size scale down.
Also Read:
7 Proven Strategies to Reduce SQL Managed Instance Costs
Azure SQL DB vs Azure SQL Managed Instance (With Diagrams)
Different database restore methods in Azure SQL MI
Step-by-Step Guide: Creating an Azure SQL Managed Instance (Pay-As-You-Go & Free Offer)
If you have any questions, feel free to leave a comment on this blog post and I’ll respond to your queries. So far, all scaling operation tests have been conducted on the General Purpose tier.
In the future, I’ll update this post with results from scaling across different service tiers, hardware series, and additional scenarios.
For more technical blogposts, visit CloudNerchuko.in